So the “a” in “loam” in the middle-bottom, it’s at an intersection of 3 lines. If I follow those lines to each side I see that loam is 60% clay, 40% silt, 60% sand, and 40% sand.
Ok, maybe I’m not supposed to follow the grey lines, but the cardinal directions? To the left, loam is 20% clay, to the right 80% silt, and below 50% sand.
The more I try to understand this chart the more confused I get.
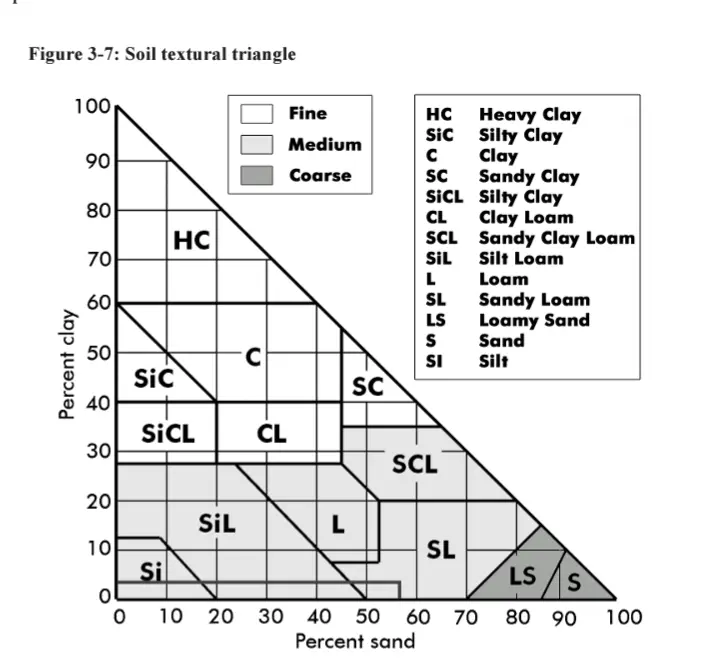
the equilateral triangle (US) one is confusing as fuck, if you’re uninformed. Basically, start with two lines, and see where they take you (e.g., 30% clay, 40% sand). The third line tells you what the remaining percentage of the 3rd textural size is (e.g., in this case, silt).
In the Right angle Triangle (Canadian one) sand and clay to derive your texture. silt is implied (e.g., solve for ‘x’).
gravel gets counted later, and classified as coarse fragments.
Took me a while too. The left numbers “clay” are the gray lines that are flat (left to right), the right numbers “silt” go top-right to bottom-left and the bottom numbers “sand” go bottom-right to top left.
The intersection of any point is the sum of the 3 numbers and always equals 100. So for example, to get “silty clay loam” (middle right side). You follow the 30% for clay line, then the 60% for silt and finally 10% for sand. Those three equals 100%.
I kept doing what you were too and could not understand why I kept getting over 100% until someone else explained it to me.
I think I get it. The arrows on the labels show the direction to read, but aren’t actually by the percentage the represent. Sand percentages are on the left, silt on the bottom, and clay on the right?
This chart would benefit from color coding the lines and moving the labels and arrows to the values that you’re supposed to read.
Not quite. Clay is on the left. Its numbers go from 0 on the bottom left to 100% at the top point and are the flat ones that are horizontal. Silt is on the right and start 0% at the point and go to 100% in the bottom right. Its lines are the diagonal ones that go down and to the left. Finally sand starts with 0 on the bottom right and goes to 100% on the bottom left. Those lines go diagonally up and to the right.

I don’t understand how to read the top one.
So the “a” in “loam” in the middle-bottom, it’s at an intersection of 3 lines. If I follow those lines to each side I see that loam is 60% clay, 40% silt, 60% sand, and 40% sand.
Ok, maybe I’m not supposed to follow the grey lines, but the cardinal directions? To the left, loam is 20% clay, to the right 80% silt, and below 50% sand.
The more I try to understand this chart the more confused I get.
Follow the orientation of the numbers. On the left, horizontal lines. On the bottom SE to NW lines (\) On the right, NE to SW lines (/)
So, loam is 20% clay, 40% sand, 40% silt.
You need a second backslash character for one to display. Currently the \ isn’t displaying.
Fixed thanks!
Oh shit, make sense now. Thank you!
the link is [email protected]
some info:
the equilateral triangle (US) one is confusing as fuck, if you’re uninformed. Basically, start with two lines, and see where they take you (e.g., 30% clay, 40% sand). The third line tells you what the remaining percentage of the 3rd textural size is (e.g., in this case, silt).
In the Right angle Triangle (Canadian one) sand and clay to derive your texture. silt is implied (e.g., solve for ‘x’).
gravel gets counted later, and classified as coarse fragments.
Didn’t realize there was one unique size for gravel. I’d call gravel anything from slightly bigger than sand to bit smaller than a golf ball.
Bruh, there’s tons of different sizes for gravel and coarse fragments:
Right that’s what I mean! Your first graph made it seem like there was just that one size. That table is super interesting thanks.
Haha, check out my soil science community. There are rabbit holes (and pictures of holes!) A-plenty there
Took me a while too. The left numbers “clay” are the gray lines that are flat (left to right), the right numbers “silt” go top-right to bottom-left and the bottom numbers “sand” go bottom-right to top left.
The intersection of any point is the sum of the 3 numbers and always equals 100. So for example, to get “silty clay loam” (middle right side). You follow the 30% for clay line, then the 60% for silt and finally 10% for sand. Those three equals 100%.
I kept doing what you were too and could not understand why I kept getting over 100% until someone else explained it to me.
I think I get it. The arrows on the labels show the direction to read, but aren’t actually by the percentage the represent. Sand percentages are on the left, silt on the bottom, and clay on the right?
This chart would benefit from color coding the lines and moving the labels and arrows to the values that you’re supposed to read.
Not quite. Clay is on the left. Its numbers go from 0 on the bottom left to 100% at the top point and are the flat ones that are horizontal. Silt is on the right and start 0% at the point and go to 100% in the bottom right. Its lines are the diagonal ones that go down and to the left. Finally sand starts with 0 on the bottom right and goes to 100% on the bottom left. Those lines go diagonally up and to the right.
deleted by creator
From my understanding, the grey lines are for the silt and clay axis, the sand axis is just read vertically and there are no lines.